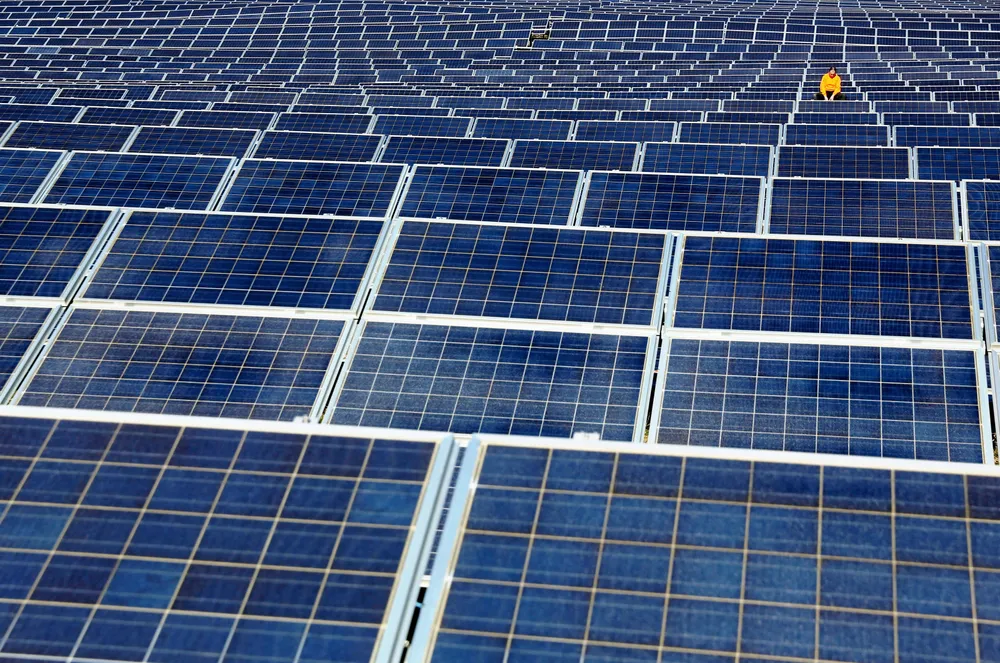
Green hydrogen produced wholly from solar power would not be able to receive the top $3/kg rate of the US production tax credit (PTC) due to the upstream emissions from the manufacturing of solar panels, according to figures in a new report by the International Energy Agency (IEA).

Hydrogen: hype, hope and the hard truths around its role in the energy transition
Will hydrogen be the skeleton key to unlock a carbon-neutral world? Subscribe to the weekly Hydrogen Insight newsletter and get the evidence-based market insight you need for this rapidly evolving global market

And only wind power made using the most eco-friendly turbines would qualify for the $3/kg PTC rate, due to the lifecycle greenhouse gas (GHG) emissions rules set out in last year’s Inflation Reduction Act (IRA).

According to the IRA, only clean hydrogen projects with lifetime GHG emissions lower than 0.45 kilograms of CO2-equivalent (CO2e) per kilogram of H2 would quality for 100% of the PTC — $3/kg (when also meeting the act’s wage requirements).

Projects with lifecycle GHGs of 0.45-1.5kgCO2e/kgH2 will only get 33.4% of the full US tax credit ($1/kg), while those with 1.5-2.5kg would receive 25%, and facilities with 2.5-4kg would qualify for 20%.

“Based on lifecycle analysis, the production of [crystalline-silicon] solar PV modules, for example, is currently associated with emissions of 18-50g CO2-equivalent/kWh, which would result in an emissions intensity of hydrogen production of 0.9-2.5 CO2e/kg H2,” says the report, Towards hydrogen definitions based on their emissions intensity.

Crystalline-silicon — which is specified in a footnote to the above quote — is by far the most common type of solar panel.

Non-silicon solar panels, such as those produced by US manufacturer First Solar, are said to have significantly lower carbon intensity during production, and therefore could be better placed to enable green hydrogen producers to reach that $3/kg rate. However, such cadmium-based thin-film technology is not mentioned in the IEA report, so it is not known if it would meet the 0.45kgCO2/kgH2 threshold.

The IEA tells Hydrogen Insight that until the details about regulations for the US PTC have been published by the US Treasury, “it is not possible to assess the eligibility of projects for the tax credit”.

It also states out that the GREET model specified for lifecycle greenhouse gas assessment in the IRA “assumes zero emissions for hydrogen produced from solar PV and wind”.

The stated solar-based emissions intensity of 0.9-2.5CO2e/kgH2 would also mean that solar-derived hydrogen would also not qualify for Canada’s top rate of subsidy in its own recently announced production tax credits, which provide 40% tax relief on projects with lifecycle GHG emissions of less than 0.75kgCO2e/kgH2.

Green hydrogen made solely with onshore wind power would also struggle to qualify for the $3/kg US tax credit, according to the IEA report.

“In the case of onshore wind, embedded emissions of 8-16g CO2e/kWh [in wind turbines] would translate into an emissions intensity of 0.4-0.8kg CO2e/kg H2,” it explains.

No figures are given for hydrogen made from offshore wind.

And to the dismay of green H2 advocates, the IEA gives hydrogen produced from nuclear energy a lifecycle GHG rate of 0.1-0.3kgCO2e/kgH2, meaning that it would certainly quality for the top PTC rates in the US and Canada.

The only other method of hydrogen production that would qualify for the $3/kg rate would be biomass gasification with carbon capture — an expensive set-up that would actually enable negative emissions because biomass absorbs CO2 from the air as it grows.

Hydrogen Insight has compiled all the lifecycle GHG emissions from the different types of H2 production mentioned in the IEA report in the following table (see notes below).

Production method Lifecycle greenhouse gas emissions (kgCO2e/kgH2)
Biomass gasification with CCS (capture rate of 95%) (wood chips) minus 21-minus 16
Electrolysis from nuclear power 0.1-0.3
Electrolysis from onshore wind 0.4-0.8
Partial oxidation of natural gas with CCS (capture rate of 99%) 0.8-4.6
Electrolysis from solar power 0.9-2.5
Biomass gasification (wood chips) 1.0-4.7
Steam methane reformation (natural gas) with CCS (capture rate of 93%) 1.5-6.2
Methane pyrolysis using plasma burners (depends on electricity used) 2-16
Coal gasification with CCS (capture rate of 93%) 2.6-6.3
Natural gas SMR with retrofitted CCS (capture rate of 50%) 5-8
Natural gas SMR without CCS (using global median upstream and midstream emissions) 11
Coal gasification 22-26
Electrolysis from grid electricity (from natural-gas-fired power) 24-32
Electrolysis from grid electricity (from coal-fired power) 50-57

Notes on the table

These figures include upstream and midstream greenhouse gas emissions from natural gas and coal, as well as emissions from the production of equipment.

Methane pyrolysis — which heats natural gas in the absence of air to produce hydrogen and solid carbon, rather than CO2 — has higher emissions figures than steam methane reformation (SMR), which does produces CO2, due to the higher amounts of fossil gas required, the report states.

The IEA report does not provide figures for autothermal reforming (ATR), an alternative method of producing blue hydrogen and CCS, which is said to enable higher carbon capture rates than SMR. The paper explains: “ATR technology without CO2 capture is already used today in the chemical industry, but no ATR plant with CCS is in operation yet, though several projects are planned.”

The capture rates stated in the table appear to be the top rates allowed by each technology.

This article was updated on 14 April to add comments from the IEA. The headline was also amended to remove the suggestion that the IEA had concluded that solar-derived hydrogen would not qualify for the $3/kg PTC rate.